border border

Avengers Bot

Team members

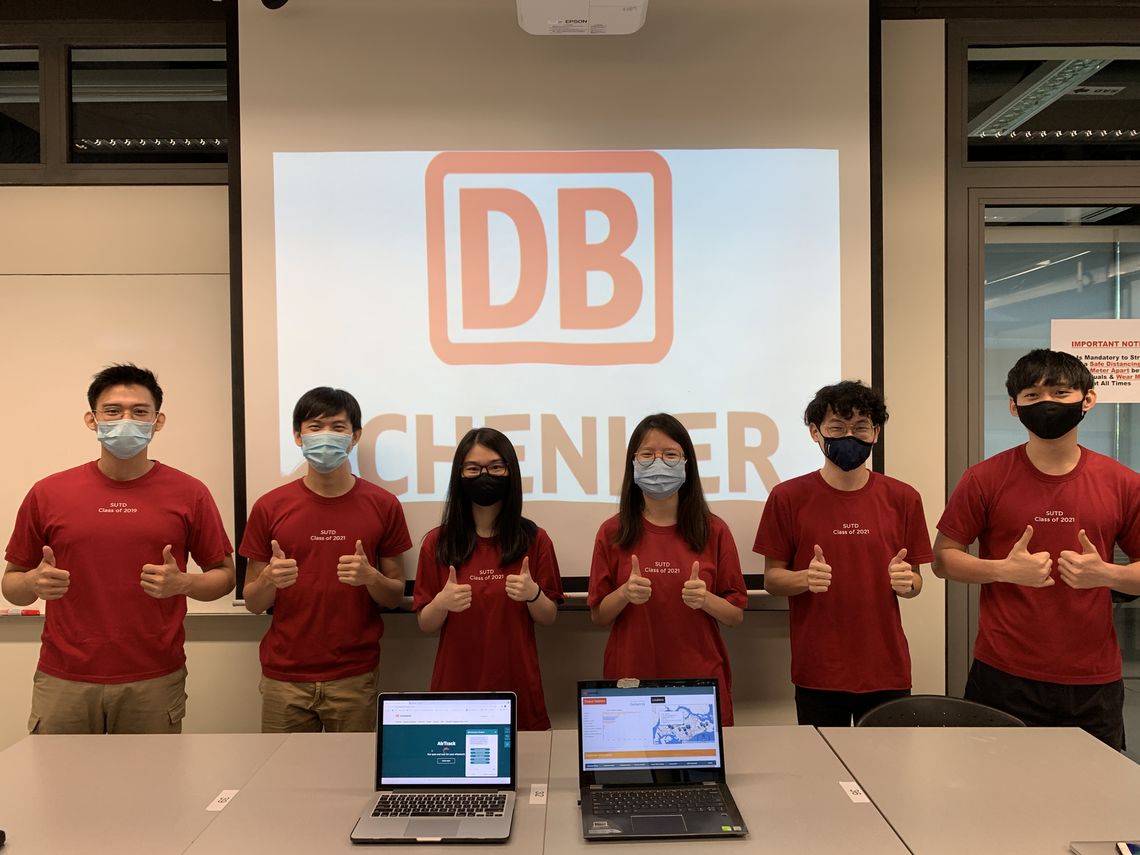
Zaidy Farid Tang Hsiao Ping (ESD), Lizabeth Mirabel Tukiman (ESD), Lim Yang Zhi (ISTD), Pung Tuck Wei (ISTD), Kwa Li Ying (ISTD), Soo Ming Wei (ISTD)

Instructors:

Yue Mu, Norman Lee Tiong Seng

Writing Instructors:

Nurul Wahidah Binte Mohd Tambee

Teaching Assistant:

Siddharth Kumar

Problem Statement

As the current website is difficult and time-consuming to navigate, potential customers cannot obtain the information they seek, resulting in lost business opportunities. This project aims to design a chatbot prototype on the DB Schenker website, which will be available for customers to use 24/7 and aid customers in obtaining information. It also aims to provide the DB Schenker sales team with information for follow-up with interested customers through an accompanying dashboard, thus increasing sales.


Our Solution

solution architecture


Chatbot Features

Video of DB Schenker Red Lion warehouse

Customers who want to view the DB Schenker Red Lion warehouse can do so through the chatbot.

Links to relevant webpages

The chatbot’s responses always include a link to a relevant webpage for customers who would like to read further and find out more information. Easily navigate to these pages by typing keywords in the chatbot.

Prompts for frequently asked questions

Answers for frequently asked questions can be obtained with a few clicks. Customers no longer need to search the entire website for this information, making it more convenient.

Collection of customer information

Interested customers can leave their contact information through the chatbot for a salesperson to contact them. This information will be presented in a dashboard for the DB Schenker sales team, making the follow-up process easier.


Dashboard Features

Bar chart displaying frequently asked categories

The chatbot categorises questions asked by customers into groups called intents. The bar chart displays the number of counts of each intent, sorted with the highest count on top. It also shows the most popular intent of the month.

Map displaying customer location

The map displays each customer’s location using a marker. Each marker on the map can be clicked to view more information about the customer, such as their email and company name.

Table displaying customer contact information

The information in the table can be updated accordingly through the dashboard. There is also a sorting feature for the user to view the customers with the highest counts of visit to the chatbot or the customers who have not been contacted yet. The pagination feature accounts for increasing amounts of customer information.

Export information to Excel

The information on the dashboard can be exported to Excel for easy distribution of data within DB Schenker.


img 1219


Industry Partner

dbschenkerlogofull

TEAM MEMBERS

student Zaidy Farid Tang Hsiao Ping Engineering Systems and Design
student Lizabeth Mirabel Tukiman Engineering Systems and Design
student Lim Yang Zhi Information Systems Technology and Design
student Pung Tuck Wei Information Systems Technology and Design
student Kwa Li Ying Information Systems Technology and Design
student Soo Ming Wei Information Systems Technology and Design
border border